
How to check ram in Linux Ubuntu in command line. Using terminal one can check total memory in Linux in GB. Learn how to check ram size in Linux command line in Gb.
free Command
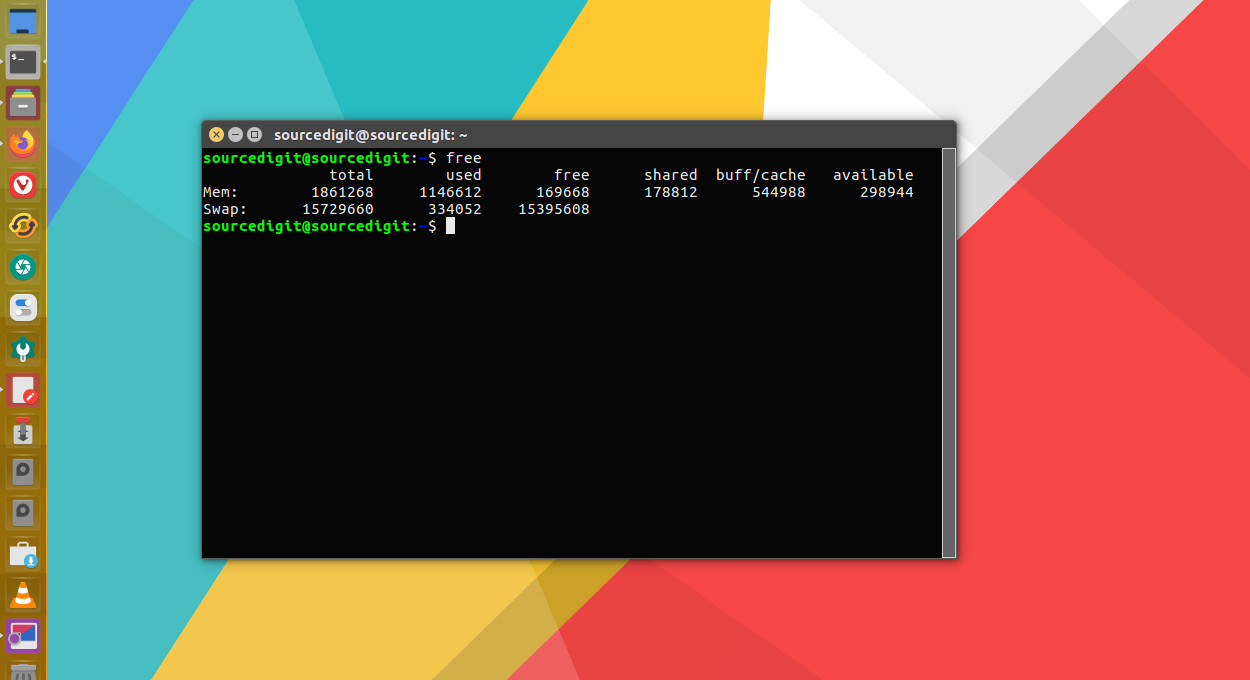
free displays the total amount of free and used physical and swap memory in the system, as well as the buffers and caches used by the kernel. The information is gathered by parsing /proc/meminfo.
The displayed columns after the execution of the free command are:
- total: Total installed memory (MemTotal and SwapTotal in /proc/meminfo)
- used: Used memory (calculated as total – free – buffers – cache)
- free: Unused memory (MemFree and SwapFree in /proc/meminfo)
- shared: Memory used (mostly) by tmpfs (Shmem in /proc/meminfo, available on kernels 2.6.32, displayed as zero if not available)
- buffers: Memory used by kernel buffers (Buffers in /proc/meminfo)
- cache: Memory used by the page cache and slabs (Cached and Slab in /proc/meminfo)
- buff/cache: Sum of buffers and cache
- available: Estimation of how much memory is available for starting new applications, without swapping. Unlike the data provided by the cache or free fields, this field takes into account page cache and also that not all reclaimable memory slabs will be reclaimed due to items being in use (MemAvailable in /proc/meminfo, available on kernels 3.14, emulated on kernels 2.6.27+, otherwise the same as free)
-b, –bytes: Display the amount of memory in bytes.
-k, –kilo: Display the amount of memory in kilobytes. This is the default.
-m, –mega: Display the amount of memory in megabytes.
-g, –giga: Display the amount of memory in gigabytes.
–tera: Display the amount of memory in terabytes.
-h, –human: Show all output fields automatically scaled to shortest three digit unit and display the units of print out. Following units are used.
B = bytes
K = kilos
M = megas
G = gigas
T = teras
top Command
Ubuntu users can also use top command to check memory and cpu usage per process. It reports total memory usage and also total RAM usage by the processes.
The top program provides a dynamic real-time view of a running system. It can display system summary information as well as a list of processes or threads currently being managed by the Linux kernel. The types of system summary information shown and the types, order and size of information displayed for processes are all user configurable and that configuration can be made persistent across restarts.
The program provides a limited interactive interface for process manipulation as well as a much more extensive interface for personal configuration — encompassing every aspect of its operation. And while top is referred to throughout this document, you are free to name the program anything you wish. That new name, possibly an alias, will then be reflected on top’s display and used when reading and writing a configuration file.
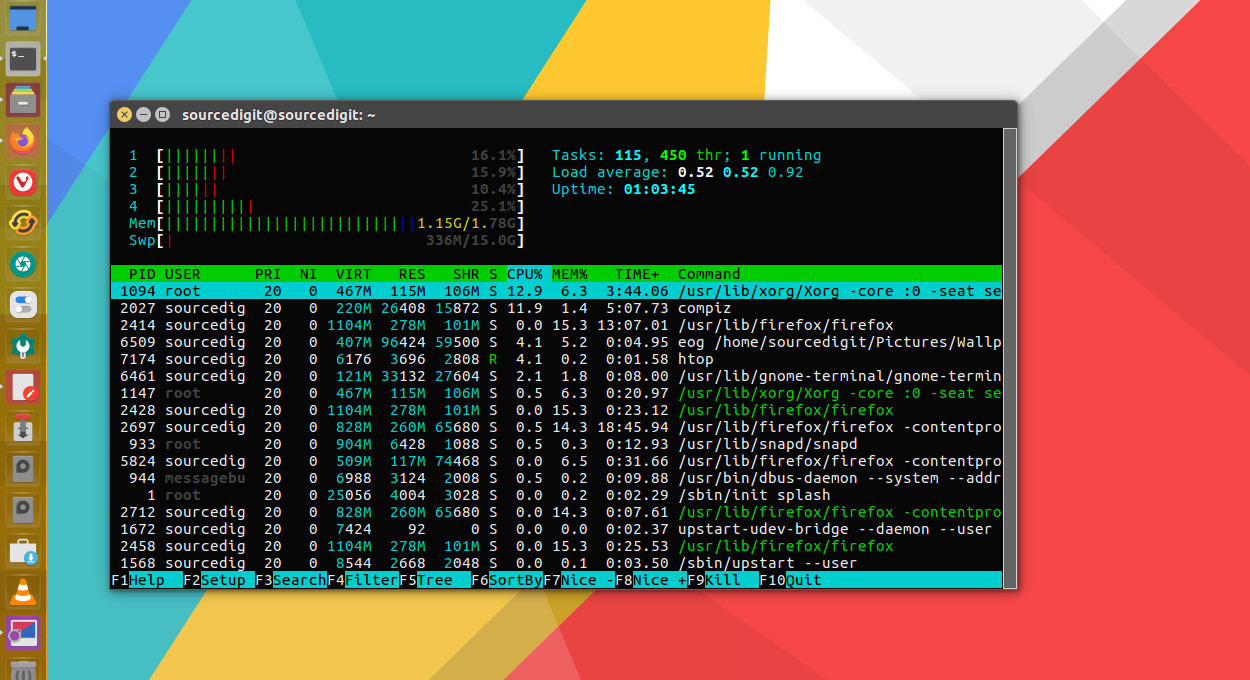
Similar to the top command, the htop command also shows memory usage along with various other details. When the htop command in executed, the header on top shows cpu usage along with RAM and swap usage.