
How to check total virtual memory size in Linux Ubuntu? Here are the commands to check virtual memory usage in Linux Ubuntu.
Virtual Memory
Linux supports virtual memory, that is, using a disk as an extension of RAM so that the effective size of usable memory grows correspondingly. The kernel will write the contents of a currently unused block of memory to the hard disk so that the memory can be used for another purpose. When the original contents are needed again, they are read back into memory. This is all made completely transparent to the user; programs running under Linux only see the larger amount of memory available and don’t notice that parts of them reside on the disk from time to time. Of course, reading and writing the hard disk is slower (on the order of a thousand times slower) than using real memory, so the programs don’t run as fast. The part of the hard disk that is used as virtual memory is called the swap space.
Linux can use either a normal file in the filesystem or a separate partition for swap space. A swap partition is faster, but it is easier to change the size of a swap file (there’s no need to repartition the whole hard disk, and possibly install everything from scratch). When you know how much swap space you need, you should go for a swap partition, but if you are uncertain, you can use a swap file first, use the system for a while so that you can get a feel for how much swap you need, and then make a swap partition when you’re confident about its size.
You should also know that Linux allows one to use several swap partitions and/or swap files at the same time. This means that if you only occasionally need an unusual amount of swap space, you can set up an extra swap file at such times, instead of keeping the whole amount allocated all the time.
As defined by Linux System Administrators Guide: The Linux Documentation Project https://www.tldp.org
vmstat
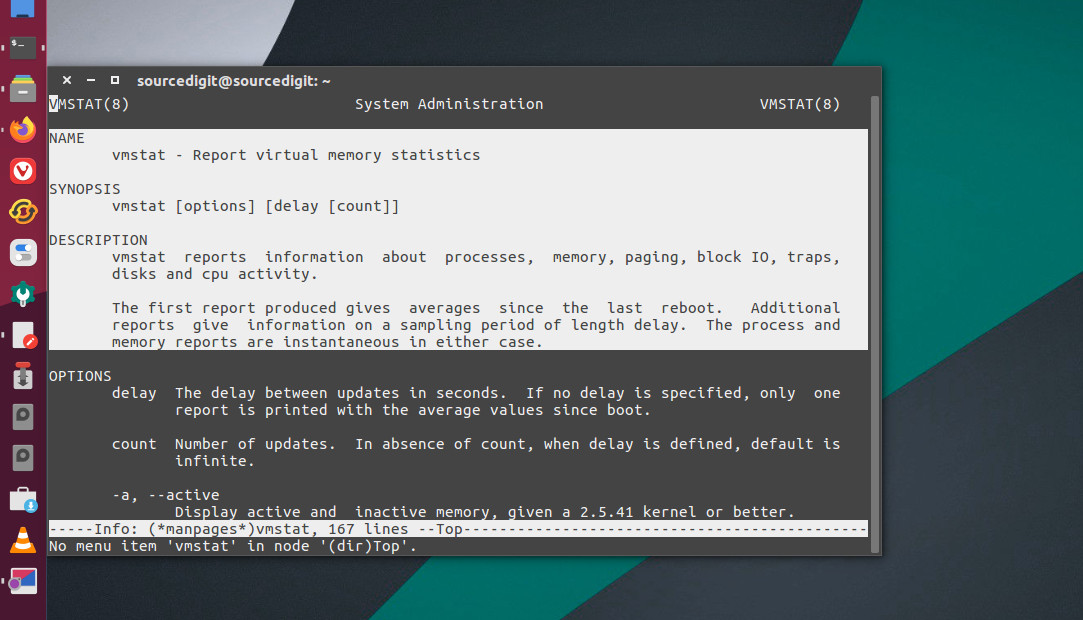
vmstat command is used to display virtual memory statistics. vmstat reports information about processes, memory, paging, block IO, traps, disks and cpu activity. The first report produced gives averages since the last reboot. Additional reports give information on a sampling period of length delay. The process and memory reports are instantaneous in either case.
The command usage syntax is vmstat [options] [delay [count]]
vmstat command options
delay: The delay between updates in seconds. If no delay is specified, only one report is printed with the average values since boot.
count: Number of updates. In absence of count, when delay is defined, default is infinite.
-a, –active: Display active and inactive memory, given a 2.5.41 kernel or better.
-s, –stats: Displays a table of various event counters and memory statistics. This display does not repeat.
-d, –disk: Report disk statistics.
-p, –partition device: Detailed statistics about partition.
free
free command displays amount of free and used memory in the system. free displays the total amount of free and used physical and swap memory in the system, as well as the buffers and caches used by the kernel. The information is gathered by parsing /proc/meminfo.
The proc is the process information pseudo-filesystem which provides an interface to kernel data structures. It is commonly mounted at /proc. Most of it is read-only, but some files allow kernel variables to be changed.
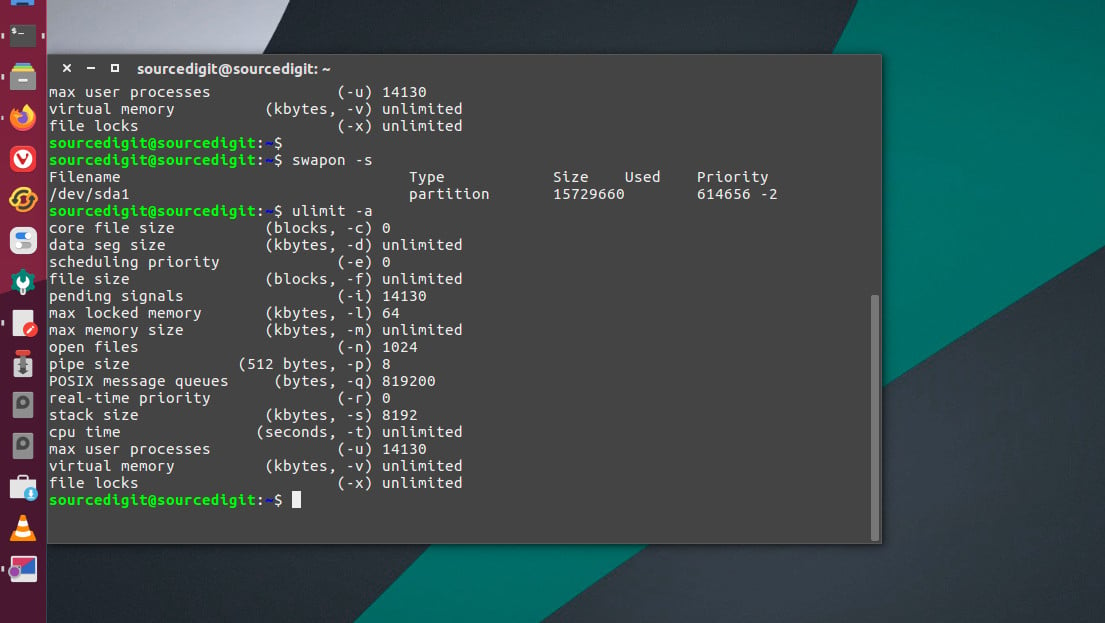
You can also see the virtual memory size using swapon -s or free and cache size using /proc/cpuinfo. One can also use the command ulimit -a to find the virtual memory size.