
RTX 3000 laptops have been available for a couple of months now. Still, as they always do, Nvidia first launched their higher-tier (and expensive) RTX 3080 and 3070 SKUs, later followed by the mid-tier 3060 models and only a few months later by the true-value chips, the RTX 3050Ti, and 3050 Laptop chips.
However, these are the GPU options that most people are going to buy. They will make it into mainstream laptops that sell for way under 1000 USD/EUR and still provide enough power to handle everyday activities and FHD gaming at High and even Ultra settings in some cases. We’ve spent time with an RTX 3050Ti notebook, and this article gathers our first impressions and benchmarks, as well as a quick look at how this compares to the 3060 and 3070 options out there.
We’ll also look at how the 3050 chips fare against the older 1060 and 1650 notebooks, as these are potential upgrade paths for those of you that own one of those 2-3 years old laptops now. However, I’d rather wait and test a few more 3050 and 3050Ti implementations first before drawing any conclusions, because just like with the higher-tier RTX 3000 chips, the performance of these 3050 configurations is going to vary between the different SKUs, based on the TDP settings that the OEM decide on for each unit, and their thermal designs.
Back to this article, we’re looking at a 3050Ti configuration of the Asus TUF Dash F15, with a TDP of 60W and Dynamic Boost 2.0 up to 75W in supported games. We’ve already tested the RTX 3070 (80-85W) version of the Dash F15 earlier in the year, and we’ll compare the graphics performance of the two, as well as throw in a 60+W RTX 3060 (in the Zephyrus G14) and an 80+W RTX 3060 model (in the TUF A15) for comparison as well (might take a few days, I’m still working on some of those benchmarks).
Oh, and I wouldn’t frat about these test models being either AMD Ryzen 9 or Tiger Lake H35 here; even if the i7-11370H is a quad-core CPU, it’s actually a perfect match for a mid-level GPU such as these 3050s when it comes to gaming and combined loads, as you’ll see down below. Plus, the point of this article is to look at the GPU’s abilities, and less so at the TUF Dash F15 notebook, which we’ll cover in a separate article very shortly.
But first, a quick look at the specs sheets of the RTX 3000 Laptop GPUs.
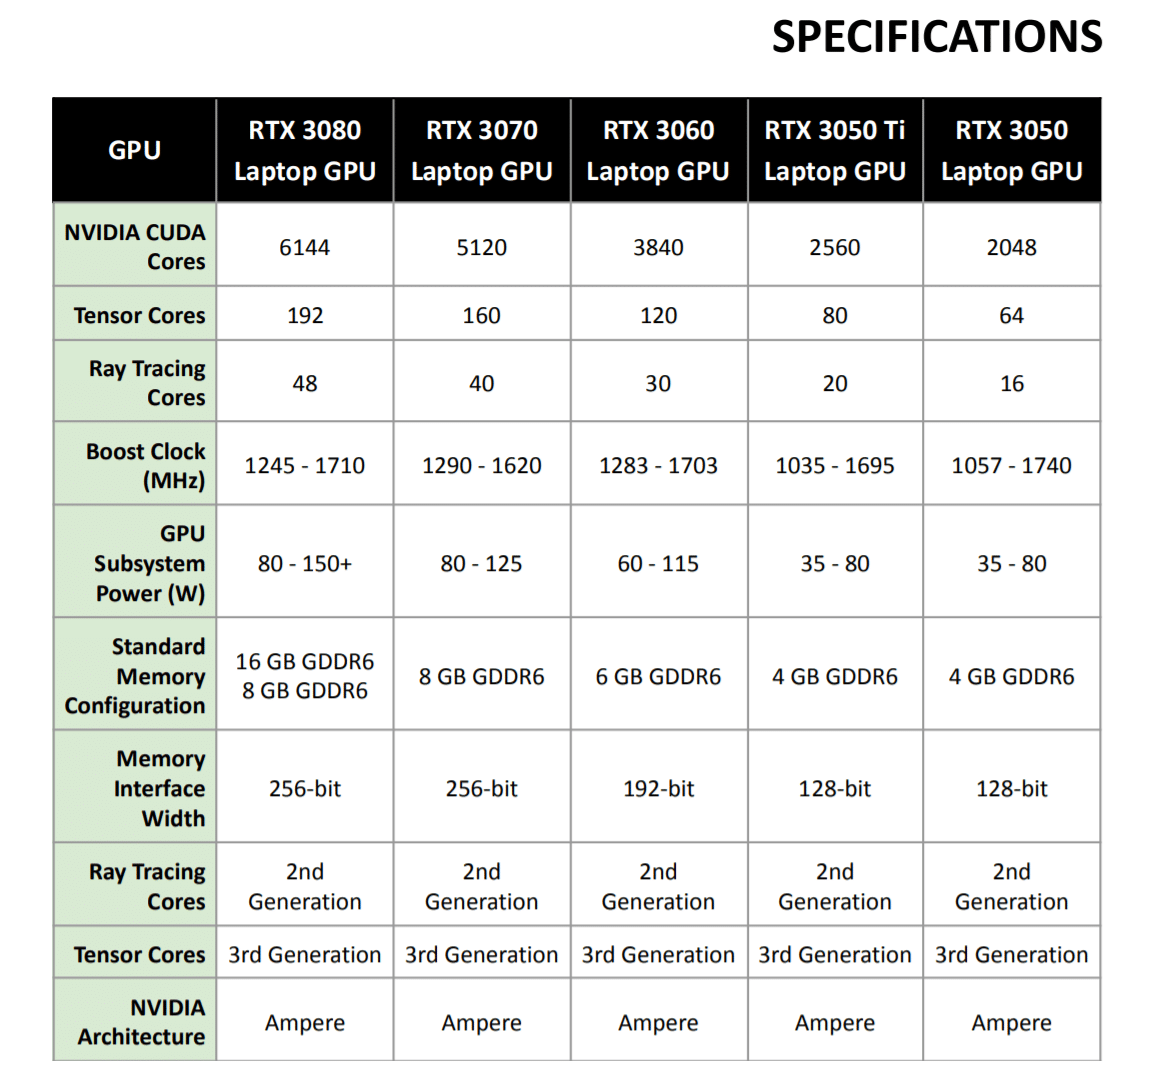
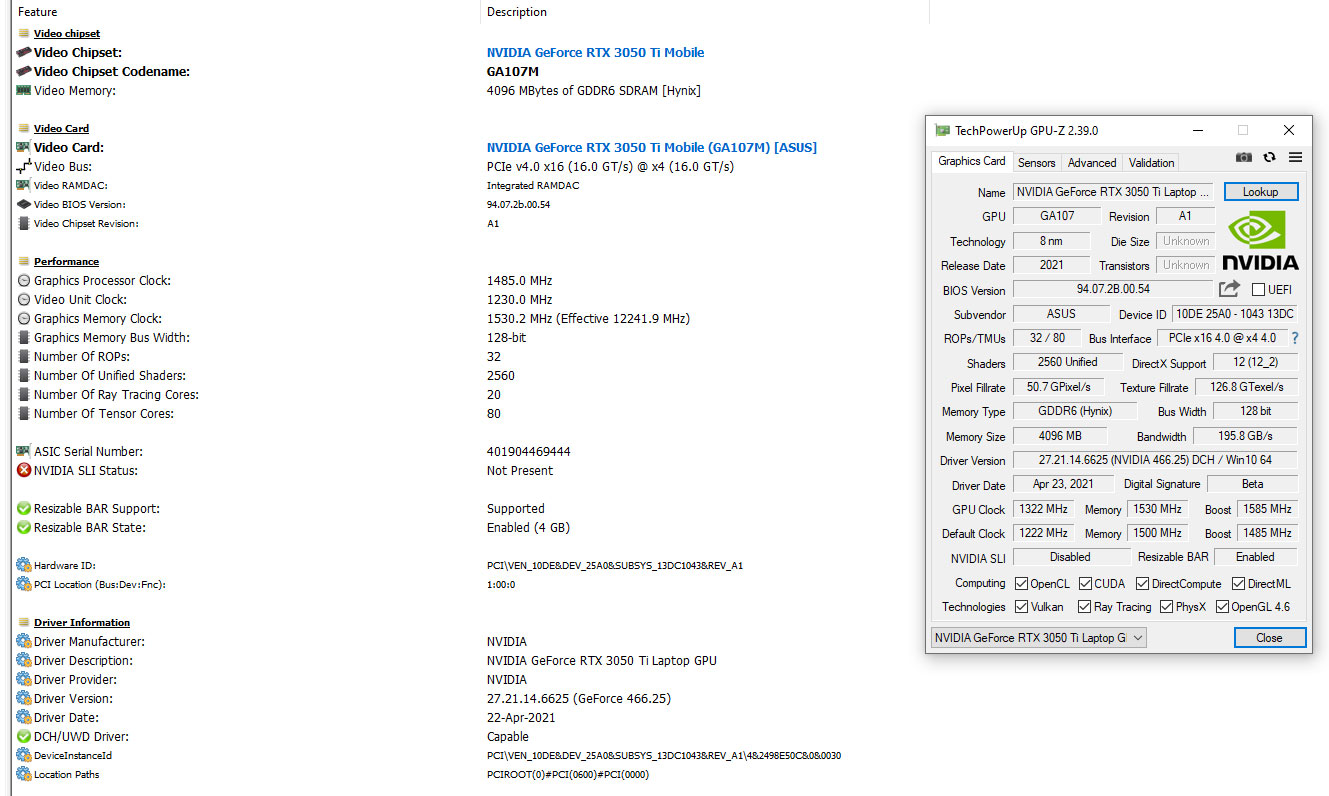
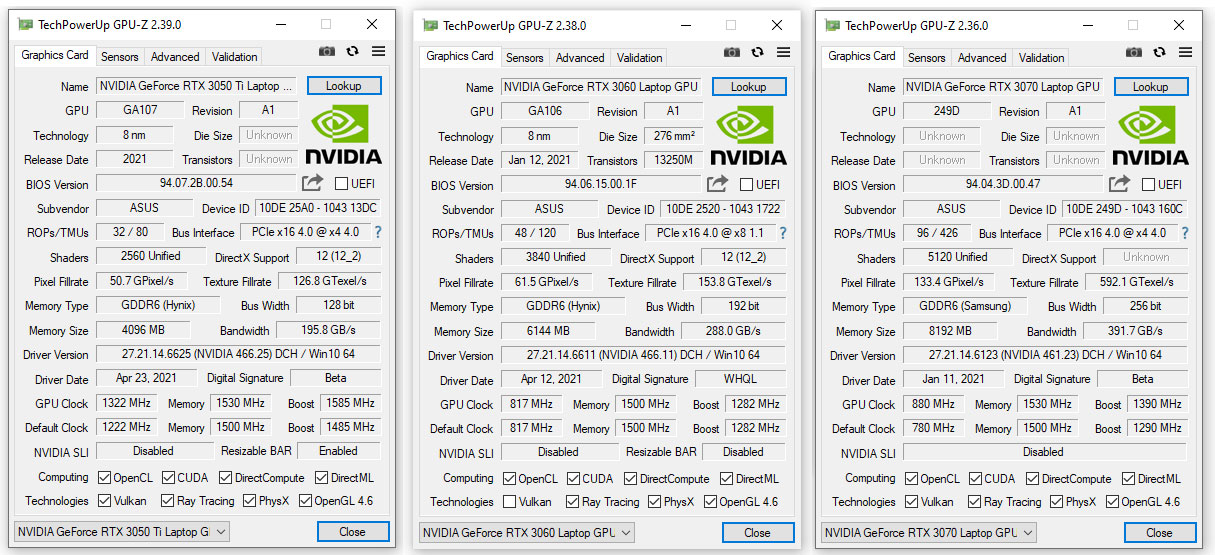
On paper, the 3050Ti is pretty much half the CUDA and RT cores of a 3070, with half the amount of memory and bandwidth. That’s confirmed by the GPU-Z shots down below of the 3070 and 3050Ti implementations in the same Dash F15 chassis.
The 3050Ti is also 66% of the cores and memory of an RTX 3060, so at least in theory and in an ideal apples-to-apples power/thermal setup, the 3050Ti should be half the performance of a 3070 and 66% of the performance of a 3060.
The regular 3050 gets even fewer CUDA and RT cores, which suggests around 75-80% of the performance of a 3050Ti, again, in an ideal comparison setup.
In practice, though, it turns out the 3050Ti is a lot more capable than it might seem on paper, even if on our samples we’re looking at a 60-75 W 3050Ti, a 60-80W 3060, and an 80-85W 3070, so not same-power implementations.
Let’s have a look at these synthetic benchmarks first. Keep in mind we’re running on the Turbo profile, the higher-performance profile available in the Armory Crate control app on Asus laptops, which overclocks all the GPUs are +100 MHz core / +120 MHz Memory.
| i7-11370H + 3050Ti 60-75W | R9-5900H + 3060 60-80W | i7-11370H + 3070 80-85W | |
| 3DMark 13 – Fire Strike | 12652 (Graphics – 14629, Physics – 14485, Combined – 5743) | 15848 (Graphics – 16852, Physics – 25120, Combined – 7923) | 17438 (Graphics – 22319, Physics – 14370, Combined – 7517) |
| 3DMark 13 – Port Royal | DNR | 3799 | 5040 |
| 3DMark 13 – Time Spy | 5676 (Graphics – 5763, CPU – 5234) | 6812 (Graphics – 6543, CPU – 9961) | 7499 (Graphics – 8156, CPU – 5151) |
| Uniengine Superposition – 1080p Medium | 3324 | 3917 | 5463 |
| Uniengine Superposition – 1080p Extreme | 10513 | 12148 | 16526 |
| PassMark | 3358 (CPU: 13270, 3D Graphics: 8762, Disk: 24209) | 5223 (CPU: 24546, 3D Graphics: 11299, Disk: 26963) | 3783 (CPU: 13400, 3D Graphics: 11504, Disk: 21965) |
| PCMark 10 | 6146 (E – 9774, P – 9392, DCC – 6863) | 6552 (E – 10649, P – 8184, DCC – 8759) | 6230 (E – 9303, P – 9954, DCC – 7087) |
As a full disclosure, the 3050Ti configuration was tested with more recent GeForce drivers (466.25). In contrast, the 3070 was tested with earlier drivers (461.23), which might impact these scores, so consider that as well. The 3060 was tested with the GeForce 466.11 drivers.
Anyway, the 3070 ends up outscoring the 3050Ti by a far amount in 3Dmark and Uniengine, but the gap shrinks in real-life use benchmarks such as PassMark or PCMark 10. Of course, the 3060 configuration is advantaged by the Ryzen 9 processor, so you should primarily look at the graphics scores to figure out how the 3050Ti and 3060 compare at nearly the same power.
Furthermore, the gap between the 3050Ti and the higher chips shrinks even further in games. However, there’s still a variation here between the different titles (and an advantage for the Zephyrus G14 built on the Ryzen 9 processor), with the 3070 and 3060 outmatching the 3050Ti by a greater margin in the more demanding AAA titles such as Red Dead Redemption, Metro Exodus, or Shadow of Tomb Raider.
There’s also RT support on the 3050Ti, but don’t expect a whole lot in performance. You’ll have to lower the graphics getting and make sure DLSS is ON to be able to get playable framerates with Ray Tracing activated, and even then, you’ll struggle to get 60 fps in most titles. We’ll cover that in more depth in the Dash F15 review once that’s finalized.
For now, here’s what we got, at FHD resolution and on the Turbo profile, the higher-performance profile available in the Armory crate control app, which overclocks both GPUs are +100 MHz core / +120 MHz Memory.
| FHD resolution, Turbo (OC GPU) | Intel Core i7-11370H + RTX 3050Ti Laptop 60-75W |
AMD R9 5900HS + RTX 3060 Laptop 60-80W |
Intel Core i7-11370H + RTX 3070 Laptop 80-85W |
| Battlefield V (DX 12, Ultra Preset, RTX OFF) |
75 fps (36 fps – 1% low) | 84 fps (60 fps – 1% low) | 101 fps (53 fps – 1% low) |
| Battlefield V (DX 12, Ultra Preset, RTX ON, DLSS OFF) |
32 fps (16 fps – 1% low) | 58 fps (46 fps – 1% low) | 69 fps (35 fps – 1% low) |
| Cyberpunk 2077 (DX 12, Ultra Preset, RTX OFF) |
32 fps (24 fps – 1% low) | 44 fps (33 fps – 1% low) | 61 fps (44 fps – 1% low) |
| Cyberpunk 2077 (DX 12, Ultra Preset + RTX, DLSS Auto) |
24 (16 fps – 1% low) | 40 fps (29 fps – 1% low) | 45 fps (35 fps – 1% low) |
| Dota 2 (DX 11, Best Looking Preset) |
103 fps (62 fps – 1% low) | 106 fps (65 fps – 1% low) | 101 fps (58 fps – 1% low) |
| Far Cry 5 (DX 11, Ultra Preset, SMAA) |
78 fps (62 fps – 1% low) | 91 fps (58 fps – 1% low) | 90 fps (68 fps – 1% low) |
| Metro Exodus (DX 12, Ultra Preset, RTX OFF) |
41 fps ( fps – 1% low) | 46 fps (28 fps – 1% low) | 57 fps (43 fps – 1% low) |
| Middle Earth: Shadow of Mordor (DX 11, Ultra Preset) |
126 fps (76 fps – 1% low) | 130 fps (93 fps – 1% low) | 146 fps (96 fps – 1% low) |
| Red Dead Redemption 2 (DX 12, Ultra Optimized, TAA) |
46 fps (32 fps – 1% low) | 73 fps (57 fps – 1% low) | 74 fps (47 fps – 1% low) |
| Rise of Tomb Raider (DX 12, Very High Preset, FXAA) |
77 fps (43 fps – 1% low) | – | 84 fps (47 fps – 1% low) |
| Shadow of Tomb Raider (DX 12, Highest Preset, TAA) |
61 fps (34 fps – 1% low) | 74 fps (55 fps – 1% low) | 85 fps (40 fps – 1% low) |
| Shadow of Tomb Raider (DX 12, Highest Preset, TAA, RTX Ultra) |
26 fps (18 fps – 1% low) | 46 fps (36 fps – 1% low) | 60 fps (34 fps – 1% low) |
| Strange Brigade (Vulkan, Ultra Preset) |
128 fps (96 fps – 1% low) | – | 150 fps (111 fps – 1% low) |
- Battlefield V, The Witcher 3, CyberPunk 2077 – recorded with Fraps/in-game FPS counter in campaign mode;
- Far Cry 5, Metro, Middle Earth, Strange Brigade, Red Dead Redemption 2, Tomb Raider games – recorded with the included Benchmark utilities;
- Red Dead Redemption 2 Optimized profile based on these settings.
I’ll also mention that the 3050Ti configuration of the TUF Dash F15 runs slightly quieter than the 3070, which makes sense given the difference in GPU TDP between the two. I’m looking at 45-46 dB at head-level on the 3050Ti variant and 47-48 dB at head-level on the 3070 that we tested earlier this year. On the other hand, the temperatures are roughly similar between the two, at 80+ C for the CPU and 70+ C on the GPU.
A direct comparison to the 3060 configuration doesn’t make sense here since the G14 is a smaller chassis.
OK, so that’s about all for this first look at the first 3050Ti Laptop configuration that we got to test so far, but look forward to our future updates and our full review of the Asus TUF Dash F15 FX516PE for a more in-depth analysis of this Tiger Lake H35 + RTX 3050Ti Laptop configuration at various power levels and clock settings. I’ll also add the 80+W RTX 3060 benchmarks and gaming results to this post in the next few days, and we’ll also cover other 3050 laptops once we get them.
In the meantime, I’d love to hear your thoughts and feedback on these 3050Ti results, so get in touch down below.
The post Nvidia RTX 3050Ti Laptop benchmarks and performance, vs 3060 & 3070 – a first look appeared first on UltrabookReview.com