
One of the key benchmarks that have been used in the industry is Cinebench. The latest version has been Cinebench R15, released for version 15 of Cinema 4D. In recent years it has slowly become less relevant, as Maxon has moved through to version 19 and 20 of the software. To match the latest version of the software, the company has now launched the Cinebench R20 benchmark.
The benchmark is already available from the Maxon website, working through the Windows Store or the Apple App Store on Macs. It does not look like there is a separate standalone download.
The new benchmark implements a number of new features available for x86 processors. This includes newer AVX instructions, implemented through Intel’s Embree raytracing technology, applicable on both AMD and Intel processors. The new benchmark focuses purely on CPU performance, and solves one of the issues with the R15 version – it now scales beyond 64 threads better by having a larger scene. There will be a minimum performance limit to run the new benchmark, which is listed as a memory limit.
Similar to R15, there is a single threaded test and a multithreaded test. The GPU test has been dropped (it hasn’t been relevant for a long time).
For performance, the following results are provided as standard in the benchmark download:
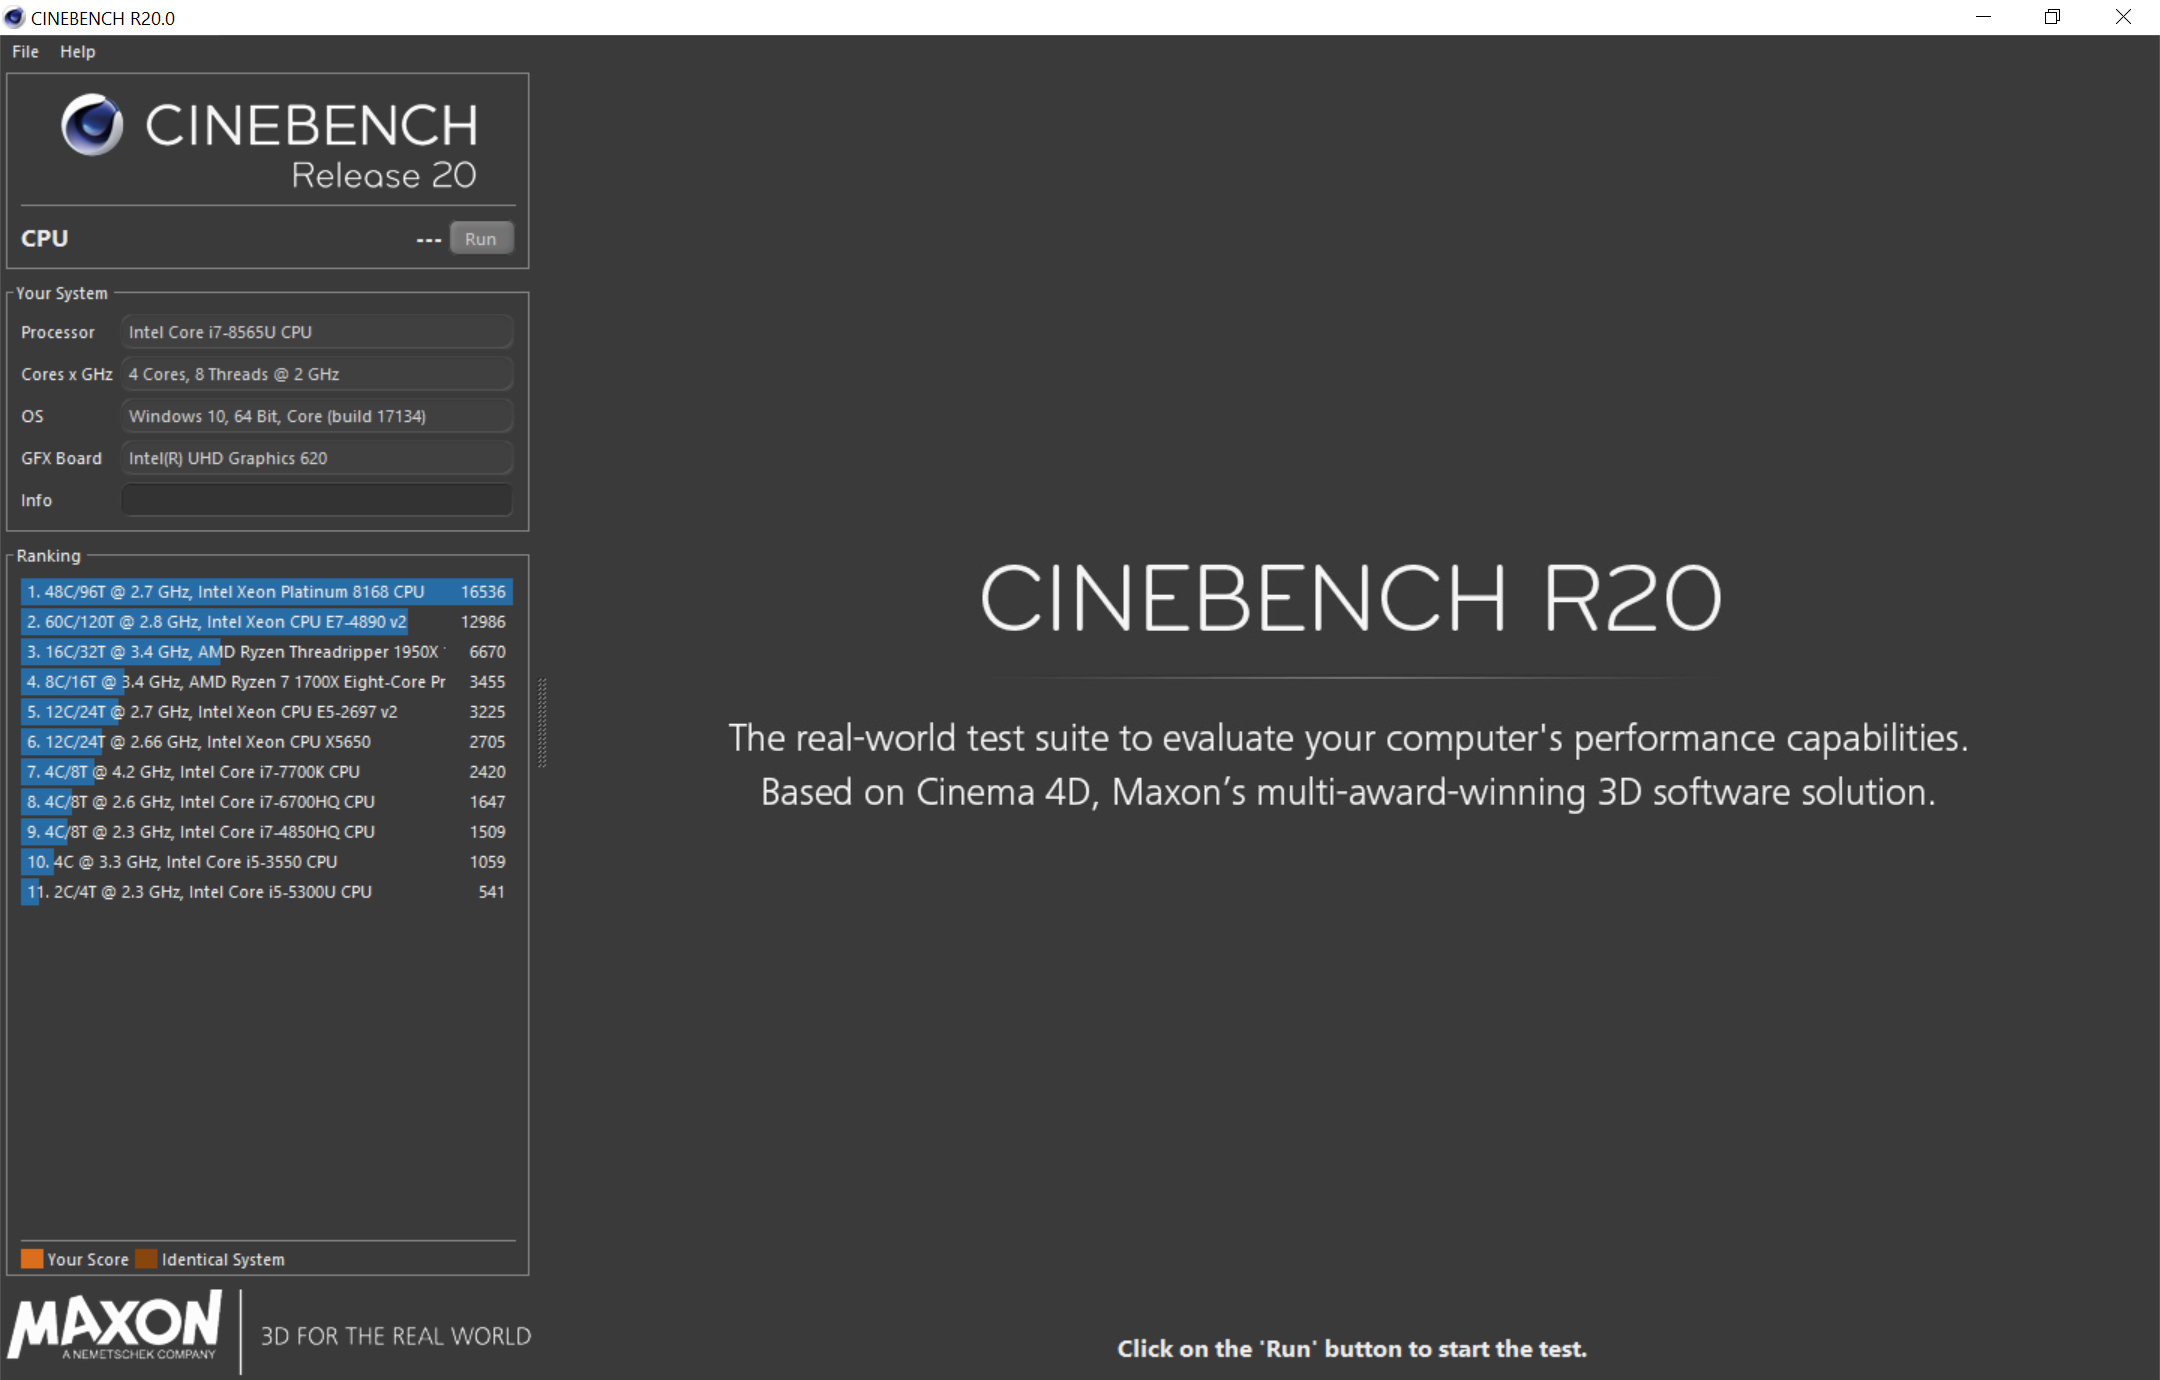
- 2x Xeon Platinum 8168, 48C/96T: 16436 points
- 4x Xeon E7-4890 v2, 60C/120T: 12986 points
- Ryzen Threadripper 1950X, 16C/32T: 6670 points
- Ryzen 7 1700X, 8C/16T: 3455 points
- Xeon E5-2697 v2, 12C/24T: 3225 points
- 2x Xeon X5650, 12C/24T: 2705 points
- Core i7-7700K, 4C/8T: 2420 points
- Core i7-6700HQ, 4C/8T: 1647 points
- Core i7-4850HQ, 4C/8T: 1509 points
- Core i5-3550, 4C/4T: 1059 points
- Core i5-5300U, 2C/4T: 514 points
With my Whiskey Lake Core i7-8565U that I’m writing this news post on, I scored 1245 points.
For the single core benchmark, the numbers are:
- Intel i7-7700K: 476 points
- AMD 1950X: 400 points
- Platinum 8168: 379 points
- AMD 1700X: 378 points
- Intel i7-6700HQ: 359 points
- Intel i7-4850HQ: 298 points
- Intel i5-3550: 283 points
- Intel i5-5300U: 280 points
- Xeon E5-2697 v2: 255 points
- Xeon E7-4890 v2: 197 points
- Xeon X5650: 191 points
The link to Maxon’s page is as follows:
https://www.maxon.net/en/products/cinebench-r20-overview/
We will be looking to see if we can roll this benchmark out across our CPU suite.

The scene being rendered